
How Furniture Retailers Can Conduct Market Research for the Dining Chair Category
- Sunbin Qi

- 3 days ago
- 5 min read
In European mid-to-premium furniture retail environments, the dining chair category is no longer a secondary add-on to dining tables. It is a margin-sensitive, trend-exposed, high-rotation category that directly influences store positioning, brand perception, and cash flow stability.
Across multi-store retailers carrying 30 to 50 dining chair SKUs, category performance often determines whether a showroom feels contemporary or outdated. Operators consistently report that dining chairs are among the most “touched, tested, and compared” products on the sales floor. Customers sit longer, ask more material-related questions, and frequently revisit before final purchase.
A dining chair program becomes commercially viable when design appeal, comfort performance, price architecture, and supply reliability are aligned within a structured assortment strategy.
This guide outlines a professional, field-tested approach to conducting market research specifically for the dining chair category, grounded in operational realities observed across European retail markets.
The Strategic Role of Dining Chairs in Furniture Retail
Dining chairs differ from sofas or beds in three important ways:
They are typically purchased in multiples.
They are highly trend-sensitive.
They sit at the intersection of ergonomics and aesthetics.
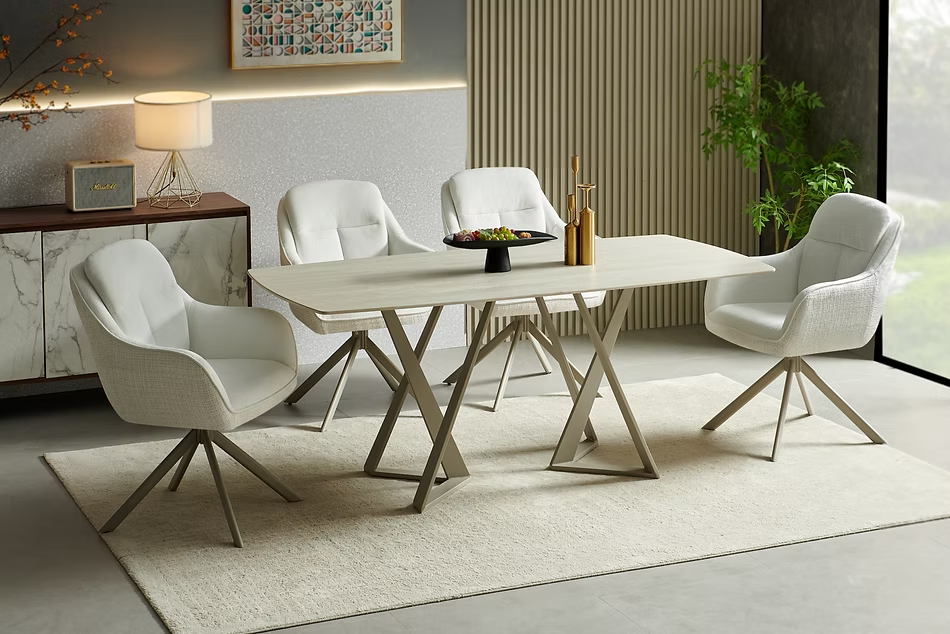
In many mid-sized European retailers, upholstered armchairs with neutral fabrics outperform minimalist shell chairs not because of trend visibility, but because customers prioritize comfort during in-store testing. Sales teams frequently note that if a chair “feels right” within the first 30 seconds, conversion probability increases significantly.
Category research must therefore go beyond visual trend scanning. It must integrate performance metrics, consumer behavior patterns, and competitive saturation analysis.
Define the Scope Before Collecting Data
Market research without defined objectives leads to descriptive reports instead of strategic decisions.
Before analyzing the dining chair category, clarify:
Are you expanding the assortment?
Are you restructuring underperforming SKUs?
Are you entering a new regional market?
Are you repositioning price architecture?
In Western European mid-market retail, the optimal SKU count typically ranges between 25 and 45 active dining chair models. Premium retailers may carry fewer models but offer deeper fabric customization.
A dining chair assortment is considered structurally balanced when no single design language exceeds 40 percent of total SKUs.
Analyze Internal Performance Data First

Internal sales data provides the most reliable signal of real demand.
Extract at least 18–24 months of historical performance data and evaluate:
Sell-through rate
Gross margin by SKU
Average units per transaction
Attachment rate with dining tables
Return rate
Stock turnover cycle
Delivery lead time
A dining chair model is commercially strong when it combines above-average sell-through with stable margin and low return rates.
Example Category Performance Snapshot
Segment | Avg. Retail Price | Sell-Through | Gross Margin | Avg. Units per Order | Return Rate |
Upholstered Armchairs | €249 | 76% | 45% | 4.1 | 3% |
Solid Wood Scandinavian | €229 | 63% | 41% | 3.7 | 2% |
Industrial Metal Frame | €189 | 54% | 38% | 3.2 | 4% |
Premium Leather Variants | €399 | 42% | 52% | 2.5 | 5% |
Across multiple European retailers, mid-range upholstered models consistently outperform visually aggressive designs in both sell-through and customer satisfaction.
Internal data should always precede trend-driven buying decisions.
Conduct Structured Competitive Benchmarking
Competitive research should focus on retailers with similar positioning, not discount chains if your brand targets mid-premium consumers.
Evaluate competitors based on:
SKU count in dining chair category
Price band clustering
Bestseller visibility
Dominant materials
Delivery promises
Online review density
Fabric and color diversity
In saturated markets, differentiation rarely comes from extreme design. It often comes from depth in comfort-driven variants and short delivery times.
Competitive Mapping Example
Competitor | SKU Count | Dominant Material | Entry Price | Bestseller Type | Delivery Time |
Retailer A | 38 | Bouclé | €199 | Upholstered | 4–6 weeks |
Retailer B | 29 | Microfiber | €149 | Minimalist | 2–4 weeks |
Retailer C | 41 | Oak + Fabric | €229 | Scandinavian | 6–8 weeks |
When three or more competitors emphasize similar materials or silhouettes, the segment may be approaching saturation.
A saturated dining chair subcategory is characterized by high visual similarity across stores and aggressive price matching.
Integrate Real Consumer Insight Signals
Quantitative data must be balanced with qualitative input.
Sales staff frequently report recurring customer concerns such as:
Seat depth comfort for long dinners
Armrest height compatibility with table clearance
Fabric durability in households with children
Ease of cleaning light-colored upholstery
Stability of lightweight frames
In several mid-sized retail environments, black metal frame chairs initially generated strong visual appeal but underperformed in repeat purchases due to perceived instability.
Customer reviews also reveal patterns that sales data may not show. Repeated mentions of pilling, wobbling, or color mismatch signal structural sourcing issues.
A recurring complaint across European dining chair buyers is extended delivery times
beyond six weeks. Speed-to-home increasingly influences purchasing decisions.
Distinguish Between Trend Signals and Commercial Stability
Not all visible trends translate into sustainable revenue.
Short-cycle trends often generate showroom attention but lack long-term volume consistency. Examples include:
Highly textured fabrics with limited color range
Overly sculptural silhouettes with narrow ergonomic tolerance
Experimental finishes prone to wear
Commercially stable dining chair programs typically share:
Neutral or adaptable color palettes
Seat heights between 45–48 cm
Fabric abrasion resistance suitable for daily use
Stackable or easy-move designs
Clear differentiation between armchair and side chair versions
A trend becomes commercially relevant when it demonstrates both consumer traction and supply chain scalability.
Validate Supplier Capabilities Before Expansion
A visually strong product is not automatically a viable SKU.
Evaluate suppliers based on:
Minimum order quantities
Lead time reliability
Fabric Martindale ratings
Packaging durability for transport
Spare part availability
Production scalability
Retailers consistently report margin erosion when MOQ structures force overstock on slow-moving variants.
A dining chair SKU becomes operationally efficient when reorder flexibility aligns with real sales velocity.
Forecast Category Potential with Structured Modeling
Projected revenue should be modeled before SKU expansion.
Estimated Category Revenue =Projected Units Sold × Average Selling Price
Projected Units Sold should factor:
Store traffic
Conversion rate
Category penetration rate
Average chairs per order
In mid-premium European retail, average chairs per transaction range between 3.5 and 4.2 units.
Forecasting multiple scenarios conservative, moderate, aggressive reduces financial exposure.
Optimize Assortment Architecture
Healthy dining chair categories typically follow structured distribution:
40% Core comfort-driven bestsellers
30% Updated trend variants
20% Entry price anchors
10% Experimental or design-led pieces
An over-concentration in trend-driven SKUs increases volatility.
An under-representation of entry price anchors reduces traffic capture.
Assortment discipline supports long-term category resilience.
Common Operational Mistakes
Retailers frequently:
Over-order trend-driven models after trade fairs
Duplicate similar silhouettes across multiple SKUs
Ignore delivery time as a conversion factor
Underestimate the importance of tactile comfort
Fail to align table and chair height compatibility
Market research must connect showroom reality, consumer psychology, and financial modeling.
Frequently Asked Questions
How often should dining chair market research be conducted?
Comprehensive review annually, with quarterly performance audits to detect margin shifts and competitor pricing changes.
What is the optimal SKU count for a mid-sized retailer?
Between 25 and 45 SKUs depending on positioning. More than 50 often increases inventory risk without proportional revenue gain.
What price band typically drives the highest volume?
In many European mid-market retailers, the €199–€279 range delivers the strongest balance between volume and margin.
Should retailers prioritize trend visibility or comfort?
Comfort drives repeat purchasing and positive word-of-mouth. Trend visibility enhances showroom traffic but should not dominate assortment planning.
How important is delivery speed?
Delivery time under four weeks increasingly influences buying decisions. Long lead times reduce conversion rates in competitive markets.
Conclusion

Market research in the dining chair category requires more than observing design trends. It demands a structured evaluation of internal performance data, competitive saturation, consumer behavior signals, supplier capability, and financial forecasting.
Retailers who systematize this process reduce overstock risk, strengthen margin stability, and build dining chair assortments that convert consistently rather than temporarily.
In a mature and competitive furniture market, disciplined category research transforms dining chairs from a style-driven product line into a predictable, performance-oriented growth engine.


Comments